Loading...

Archive

    30 June 2023, Volume 35 Issue 2 Previous Issue    Next Issue

    For Selected: Toggle Thumbnails
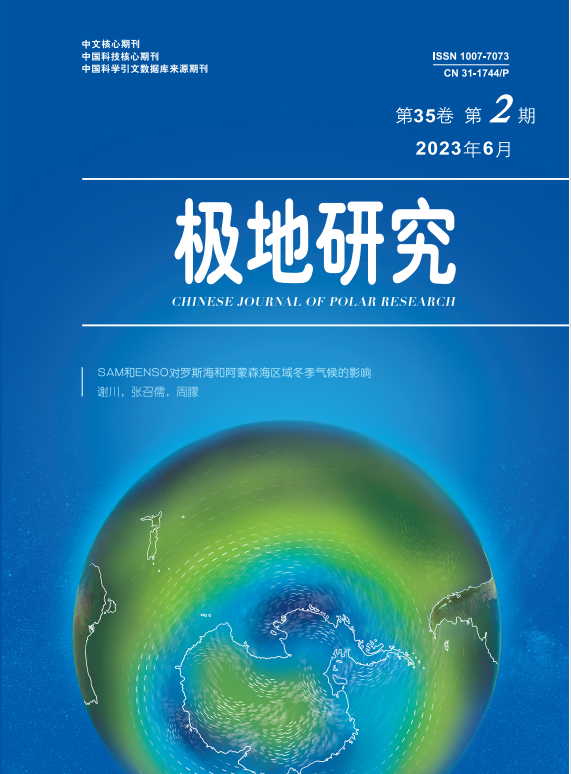
    Effects of sAM and ENSO on winter climate over the Ross Sea and the Amundsen Sea
    Xie Chuan, Zhang Zhaoru, Zhou Meng
    2023, 35 (2):  167-182.  DOI: 10.13679/j.jdyj.20220106
    Abstract ( 1017 )   PDF (11956KB) ( 654 )  
    This study used ERA5 data to conduct composite analysis of wind, air temperature, and sea level pressure in winter over the Ross and Amundsen seas when Southern Annular Mode (SAM) and El Niño-Southern Oscillation (ENSO) events occurred simultaneously, and further analyzed the effects of SAM and ENSO on the Amundsen Sea Low (ASL) in winter. Variational characteristics of regional wind during different periods were explained by Empirical Orthogonal Function (EOF) decomposition of typical regions with consideration of changes in the central position of the ASL. Results showed that SAM and ENSO mainly affect the wind by altering the zonal position of the ASL in the Ross Sea and the western Amundsen Sea. When the positive phase of SAM coincides with a La Niña event, the ASL is displaced eastward, resulting in weakening (strengthening) of southerly winds in the western (eastern) Ross Sea and weakening of easterly winds along the coast of the western Amundsen Sea. In the eastern Amundsen Sea, SAM mainly affects the regional wind by changing the meridional position of the ASL. When SAM is in negative phase, the more northerly position of the ASL leads to stronger easterly winds in the eastern Amundsen Sea. Additionally, positional offset of the ASL changes the regional atmospheric circulation. When the positive phase of SAM coincides with a La Niña event, the ASL is centered close to the western coast of the Amundsen Sea, and cold air flowing from the Antarctic continent dominates the region, resulting in abnormally low air temperatures with maximum reduction of >3°C.
    References | Related Articles | Metrics
    Variations and controlling mechanisms on ocean heat content in the Barents Sea over the past four decade
    Lai Ying, Wang Xuezhu, Ge Zhicheng, Chen Jiao, Chen Meixiang
    2023, 35 (2):  183-196.  DOI: 10.13679/j.jdyj.20220405
    Abstract ( 970 )   PDF (5690KB) ( 1318 )  
    Based on the ORAS5 reanalysis dataset, it is shown that the ocean heat content (OHC) in the Barents Sea exists significant seasonal cycle, interannual variability and increasing trend during 1979–2018. The air-sea heat flux dominates the seasonal cycle of OHC, while the interannual variability and long-term trend of OHC are mostly impacted by the oceanic heat transport of the Atlantic inflow. Both the temperature and transport can explain the interannual variability of the oceanic heat transport carried by the Atlantic inflow, however, the enhancement of the oceanic heat transport is almost determined by the increased inflow temperature. Besides, we found distinct differences in air-sea heat exchanges associated with sea ice conditions in the Barents Sea: The ocean surface heat loss reduced and the mixed layer depth became shallower in the open water while the ocean surface heat loss was enhanced and the mixed layer depth deepened in the sea ice covered area.
    References | Related Articles | Metrics
    Inversion of snow depth in Alaska based on GNSS-R technology and its application
    Chen Fanglin , Chang Liang , Feng Guiping
    2023, 35 (2):  197-211.  DOI: 10.13679/j.jdyj.20220204
    Abstract ( 857 )   PDF (4714KB) ( 992 )  
    Global navigation satellite system reflectometry (GNSS-R) technology has become an important supplement to traditional snow depth measurement. In this study, the GNSS-R technique was used to obtain snow depths near four GPS stations in Alaska during 2012–2018. In combination with snow depths from the Canadian Meteorological Centre (CMC) model, and taking snow depth data from the Plate Boundary Observatory (PBO) H2O project team as reference, variations in snow depth obtained using different methods on different time scales were analyzed. The capability of GNSS-R-derived snow depth was taken as an independent dataset to evaluate the performance of the CMC model data. Results showed that long-term snow depths from GNSS-R, CMC, and PBO all exhibit obvious and consistent periodic variation. Typically, the GNSS-R-derived results are more accurate than the CMC data in detecting interannual variation in snow depth. Both GNSS-R and CMC can capture the monthly variation seen in the PBO data for each station, although the accuracy and stability of the GNSS-R results are generally better than those of the CMC. In comparison with the CMC results, seasonal variation in GNSS-R-derived snow depth is more consistent with the PBO data. For the four studied stations, GNSS-R-derived snow depth accuracy is higher in spring and winter when snow depth is larger, and slightly worse in autumn when snow depth is smaller. Overall, GNSS-R is proven effective for evaluation of the accuracy of CMC-simulated snow depths, and the evaluation effect is generally better in winter and spring than in autumn.
    References | Related Articles | Metrics
    Comparison and evaluation of multi-source Arctic snow depth data and its impact on the estimation of sea ice thickness
    Zhou Yi, Wei Meiyi, Zhang Yu, Chen Changsheng, Xu Danya
    2023, 35 (2):  212-237.  DOI: 10.13679/j.jdyj.20220103
    Abstract ( 999 )   PDF (18676KB) ( 662 )  
    Snow depth is one of the important parameters for estimating sea ice thickness. However, there are few studies on the accuracy of different snow depth products and their applicable range, and there is also a lack of systematic cognition. In this study, eleven kinds of Arctic snow depth products are selected and divided into two evaluation periods, 2013–2018 and 2018–2019, according to different time ranges of the products. Based on this time period, the differences between the products were compared and evaluated against the in-situ observational data of “Operation IceBridge” and sea ice mass balance buoys. All products show that the snow depth is thicker in the north of Greenland and the Canadian Arctic Archipelago, and thinner along the East Siberian Sea, Laptev Sea, Kara Sea and Barents Sea. However, there are still larger differences in temporal and spatial changes of some products. Compared with the observational data of “Operation IceBridge”, most of the products are thicker. AMSR2B and IS2/CS2 have smaller difference and match better in the periods of 2013–2018 and 2018–2019 respectively. Compared with the observational data of sea ice mass balance buoys, most of the products are thinner and have larger differences. NESOSIM has a better fitting degree in the whole period. The retrieved results of sea ice thickness using snow depth of different products are significantly different. Compared with the observational data of “Operation IceBridge”, FY3B/MWRI and IS2/CS2 have the best fitting in the periods of 2013–2018 and 2018–2019, respectively. Based on the validation results of snow depth and sea ice thickness, empirical passive microwave remote sensing, satellite altimetry and combined AMSR/AVHRR have a better fitting degree, and the accuracy of snow depth reanalysis model products still needs to be further improved.
    References | Related Articles | Metrics
    Comparison and assessment of data on multi-source satellite remote sensing Arctic sea ice thickness
    Jin Yaqi, Zhang Yu, Chen Changsheng, Xu Danya
    2023, 35 (2):  238-250.  DOI: 10.13679/j.jdyj.20220301
    Abstract ( 1147 )   PDF (13943KB) ( 705 )  
    Sea ice thickness is one of the important variables of sea ice. Our knowledge of the temporal and spatial integrity of sea ice thickness is still insufficient and lags behind that of sea ice concentration, extent, and drift velocity. At present, Arctic sea ice thickness data are mostly obtained by satellite remote sensing using CryoSat-2 and SMOS, and since November 2018, ICESat-2. Few studies have evaluated the accuracy of the latest multi-source satellite Arctic sea ice thickness data or assessed the spatial and temporal differences of data from different sources. In this study, we quantified the spatial and temporal differences between the latest sea ice thickness data from ICESat-2, CryoSat-2, and CS2SMOS (merged product of CryoSat-2 and SMOS) during 2019–2020. Results show that the mean sea ice thickness is largest in CryoSat-2, second largest in ICESat-2, and smallest in CS2SMOS. There are also considerable temporal and spatial differences. For regions covered with thick sea ice, thickness is largest in ICESat-2, and the thickness in Cryosat-2 is similar to that in CS2SMOS. For marginal ice zones, thickness is largest in CryoSat-2 and smallest in CS2SMOS. The difference between the datasets is smaller over the East Siberian Sea and Beaufort Sea and larger over the Barents Sea. We compared the satellite data with field data collected during Operation IceBridge (OIB) in April 2019 and found that the difference between CS2SMOS and OIB is smaller than that between ICESat-2 and OIB.
    References | Related Articles | Metrics
    Development and application of polar subglacial shallow surface acoustic monitoring buoy system
    Li Congke, Li Bingrui, Chen Yan, Dou Yinke, Zuo Guangyu, Yang Bo, Lu Tong
    2023, 35 (2):  251-267.  DOI: 10.13679/j.jdyj.20220004
    Abstract ( 926 )   PDF (3488KB) ( 1077 )  
    Underwater acoustic studies in the Arctic Ocean play important roles in subglacial communication, navigation and positioning, target detection, and marine environmental parameter inversion. Development of an integrated polar subglacial shallow surface acoustic monitoring buoy system to obtain major environmental parameter data and subglacial acoustic characteristics information of the long-term continuous air-ice-sea interface is important for the study of subglacial hydrologic and acoustic environmental characteristics. In this study, we investigated the design and application of a polar ice acoustic buoy monitoring system, which comprises a main control module, power supply module, data acquisition module, data remote transmission module, and remote monitoring center, through development and integrated testing of the various modules, data acquisition and transmission tests, and field tests. Continuous observation of the main environmental parameters of the air–ice–sea interface in the polar region and the acoustic characteristics of the subglacial surface was realized. Field application of the system was completed during China’s 12th Arctic scientific expedition in August 2021. The system operated reliably and stably in the low temperatures and harsh polar environment, and realized the remote transmission of various polar environmental observation parameters, including underwater acoustic data.
    References | Related Articles | Metrics
    Design of a small new-energy-charging insulation room for parking Antarctic robot
    Ren Yining, Dou Yinke, Wang Yuchen
    2023, 35 (2):  268-276.  DOI: 10.13679/j. jdyj.20220205
    Abstract ( 828 )   PDF (1020KB) ( 870 )  
    In scientific exploration activities that are undertaken in Antarctica by various countries, most scientific missions are performed using automatic equipment. The operation of robots in Antarctica is difficult because the operational life of such robots is shortened and the sensitivity of their equipment is reduced owing to long-term use at low temperatures. Therefore, we propose a small new-energy-charging insulation room to park the robot in the Antarctic. The design includes an upper computer control system and a main control system with an Arduino chip at its core. This design identifies the robot through OpenMV camera and it can communicate with the Arduino chip. It is equipped with a temperature control system and a wireless charging system that can ensure long-term and efficient operation of the robot. Simulation and experimental testing revealed that the proposed design can maintain an appropriate temperature in the cold Antarctic environment, and can wirelessly charge the lithium battery of a robot, thereby resolving the problems of the endurance of scientific research robots in Antarctica and the thermal insulation of their sensor equipment.
    References | Related Articles | Metrics
    Ice sheet surface and bedrock interface extraction from ice radar image based on deep learning algorithm
    Xing Zhirui, Dou Yinke, Li Lin, Yang Wangxiao, Zhang Feng, Cui Xiangbin
    2023, 35 (2):  277-287.  DOI: 10.13679/j.jdyj.20220202
    Abstract ( 833 )   PDF (4476KB) ( 1001 )  
    The ice-rock interface at the bottom of the polar ice sheet records the historical evolution of the ice sheet, reflecting the geometric characteristics of the ice layer and the environmental properties of the ice bottom. Moreover, it is an important indicator both for inferring the dynamics of the ice sheet and for explaining the subglacial topography. Airborne ice radar is an effective method for detection of polar ice cover; however, the radar data contain many types of noise due to the detection environment and to the limitations of the instrument itself. For efficient and accurate extraction of the bedrock interface and the ice surface in an ice radar image, and for reduction in noise interference, we established an automatic method for extraction of the ice surface and bedrock interface in a radar image based on the deep learning pix2pix algorithm and observational airborne ice radar data of Princess Elizabeth Land acquired during the 32nd Chinese National Antarctic Research Expedition in 2015–2016. Experimental results showed that the accuracy of the model proposed for extracting the ice surface/bedrock interface was 0.863/0.948, and that the peak signal-to-noise ratio was 24.814 dB; i.e., higher than that realized previously using the K-SVD and CycleGAN algorithms. Thus, the proposed method was demonstrated to be more effective in removing noise, improving image quality, and restoring the common manual extraction effect with high accuracy.
    References | Related Articles | Metrics
    Review of classification methods of enstatite chondrite and its application
    Lin Jiarui, Chen Hongyi, Xie Lanfang, Zhang Jinyu, Gao Xukai, Huang Feixue
    2023, 35 (2):  288-303.  DOI: 10.13679/j.jdyj.20220203
    Abstract ( 942 )   PDF (17420KB) ( 550 )  
    Enstatite chondrites are one of the most reduced types of meteorites found, originating from close to the inner region of the solar protoplanetary disk, and are of great importance to the study of the evolution of the early solar nebulas and the origin of the Earth. This paper reviews the petrological and mineralogical characteristics of different types of enstatite chondrites, sorts the classification criteria of different subtypes, and discusses the origin of their parent bodies. Abee (EH4), which fell in 1952, and GRV 13100 (EH4), which was recovered from Grove Mountain, Antarctica, in 2013, were redefined and subdivided in terms of these classification criteria. Abee was redefined as EHb-5β type (debris and matrix) or EHb-6β type (dark inclusion), while GRV 13100 was subdivided into EHa-4α type. The origin of the parent bodies of these enstatite chondrites, and the peak temperature during metamorphism and the degrees of equilibrium after metamorphism, are directly reflected by the comprehensive use of subgroups a and b and the textural–mineralogical classification method.
    References | Related Articles | Metrics
    Research on the status of polar scientific research and expedition standards development and its countermeasures
    Luo Guangfu, Li Bingrui, Gao Yuan, Chen Chao, Lan Musheng, He Jianfeng
    2023, 35 (2):  304-314.  DOI: 10.13679/j.jdyj.20220302
    Abstract ( 988 )   PDF (446KB) ( 1863 )  
    This article reviews the current status of polar scientific research and expedition standards. The results revealed that there are only 6 national standards and 10 industrial standards for polar investigation, representing 3.4% of the total number of marine industry standards and 1.1% of the total number of natural resources industry standards. Most polar investigation standards are basic general standards, and polar surveying, observation, and monitoring standards are lacking. By combining the construction concept of natural resources standard systems, and analyzing the classification methods of polar scientific research and expedition standards, a framework for a polar scientific research standard system was preliminarily constructed. On this basis, suggested action includes strengthening the revision of technical regulations into industry standards, formulating safety standards for polar investigation, and exploring the development of international standards.
    References | Related Articles | Metrics
    Analysis on influencing factors of China’s participation in Arctic environmental cooperative governance based on structural equation model
    Li Zhenfu, Liu Kun, Zhu Lilong
    2023, 35 (2):  315-325.  DOI: 10.13679/j.jdyj.20220006
    Abstract ( 779 )   PDF (765KB) ( 888 )  
    In order to strengthen China’s participation in cooperative governance of the Arctic environment, based on structural equation theory, four indicators including geographical location, policy proposition, legal convention and international status are selected to construct structural equation model that affects China’s participation in Arctic environmental cooperative governance. The relationship between the influencing factors and the role of China in the cooperative governance of Arctic environment are quantitatively analyzed. The results show that geographical location and legal conventions have a negative impact on China’s participation in Arctic environmental collaborative governance, and policy propositions and international status have a positive impact on China’s Arctic environmental collaborative governance, among which policy propositions have the greatest impact(10.4).
    References | Related Articles | Metrics
    Analysis on the navigable window period of ships in the Northwest Passage of the Arctic
    Wang Fagen, Hu Shenping, Jiao Xixin, Fu Shanshan, Xi Yongtao, Han Bing
    2023, 35 (2):  326-335.  DOI: 10.13679/j.jdyj.20220303
    Abstract ( 949 )   PDF (753KB) ( 1181 )  
    Melting of Arctic sea ice makes navigation of the Arctic Northwest Route (ANR) possible, and it is necessary to determine the navigable window of the ANR. Focusing on the ice conditions and the complex navigation environment of the ANR, a navigation risk assessment model was constructed based on system dynamics, and the process risk assessment method in the temporal dimension was proposed for determining the navigable window for shipping on the ANR. Six routes were established as simulation scenarios, and in combination with objective data of monthly average changes in wind, fog, waves, and sea ice during 2015–2021, the navigability risk for shipping on the ANR was simulated. Results showed that the navigable window of the ANR is from late August to early September; and that the optimal route is via Amundsen Bay–Prince of Wales Strait–Barrow Strait–Baffin Bay and Amundsen Bay–Victoria Strait–Peel Strait–Baffin Bay. The navigability risk for shipping on the two routes is relatively low. Overall, the ANR generally has a relatively high level of navigability.
    References | Related Articles | Metrics